Observability (Legacy)#
NOTE:
The tooling and integrations mentioned in this page is considered legacy. Observability
is now being handled via the instrumentation module (available in v0.10.20 and later.)
LlamaIndex provides one-click observability 🔭 to allow you to build principled LLM applications in a production setting.
A key requirement for principled development of LLM applications over your data (RAG systems, agents) is being able to observe, debug, and evaluate your system - both as a whole and for each component.
This feature allows you to seamlessly integrate the LlamaIndex library with powerful observability/evaluation tools offered by our partners. Configure a variable once, and you'll be able to do things like the following:
- View LLM/prompt inputs/outputs
- Ensure that the outputs of any component (LLMs, embeddings) are performing as expected
- View call traces for both indexing and querying
Each provider has similarities and differences. Take a look below for the full set of guides for each one!
Usage Pattern#
To toggle, you will generally just need to do the following:
from llama_index.core import set_global_handler

# general usage
set_global_handler("<handler_name>", **kwargs)

# W&B example
# set_global_handler("wandb", run_args={"project": "llamaindex"})
Note that all kwargs to set_global_handler are passed to the underlying callback handler.
And that's it! Executions will get seamlessly piped to downstream service (e.g. W&B Prompts) and you'll be able to access features such as viewing execution traces of your application.
NOTE: TruLens (by TruEra) uses a different "one-click" experience. See below for details.
Simple (LLM Inputs/Outputs)#
This simple observability tool prints every LLM input/output pair to the terminal. Most useful for when you need to quickly enable debug logging on your LLM application.
Usage Pattern#
import llama_index.core

llama_index.core.set_global_handler("simple")
Partner One-Click Integrations#
We offer a rich set of integrations with our partners. A short description + usage pattern, and guide is provided for each partner.
Langfuse#
Langfuse is an open source LLM engineering platform to help teams collaboratively debug, analyze and iterate on their LLM Applications. With the Langfuse integration, you can seamlessly track and monitor performance, traces, and metrics of your LlamaIndex application. Detailed traces of the LlamaIndex context augmentation and the LLM querying processes are captured and can be inspected directly in the Langfuse UI.
Usage Pattern#
from llama_index.core import set_global_handler

# Make sure you've installed the 'llama-index-callbacks-langfuse' integration package.

# NOTE: Set your environment variables 'LANGFUSE_SECRET_KEY', 'LANGFUSE_PUBLIC_KEY' and 'LANGFUSE_HOST'
# as shown in your langfuse.com project settings.

set_global_handler("langfuse")
Guides#
DeepEval#
DeepEval (by Confident AI) is an open-source evaluation framework for LLM applications. As you "unit test" your LLM app using DeepEval's 14+ default metrics it currently offers (summarization, hallucination, answer relevancy, faithfulness, RAGAS, etc.), you can debug failing test cases through this tracing integration with LlamaIndex, or debug unsatisfactory evaluations in production through DeepEval's hosted evaluation platform, Confident AI, that runs referenceless evaluations in production.
Usage Pattern#
from llama_index.core import set_global_handler

set_global_handler("deepeval")

# NOTE: Run 'deepeval login' in the CLI to log traces on Confident AI, DeepEval's hosted evaluation platform.
# Run all of your LlamaIndex applications as usual and traces
# will be collected and displayed on Confident AI whenever evaluations are ran.
...
Weights and Biases Prompts#
Prompts allows users to log/trace/inspect the execution flow of LlamaIndex during index construction and querying. It also allows users to version-control their indices.
Usage Pattern#
from llama_index.core import set_global_handler

set_global_handler("wandb", run_args={"project": "llamaindex"})

# NOTE: No need to do the following
from llama_index.callbacks.wandb import WandbCallbackHandler
from llama_index.core.callbacks import CallbackManager
from llama_index.core import Settings

# wandb_callback = WandbCallbackHandler(run_args={"project": "llamaindex"})
# Settings.callback_manager = CallbackManager([wandb_callback])

# access additional methods on handler to persist index + load index
import llama_index.core

# persist index
llama_index.core.global_handler.persist_index(graph, index_name="my_index")
# load storage context
storage_context = llama_index.core.global_handler.load_storage_context(
    artifact_url="ayut/llamaindex/my_index:v0"
)
Guides#
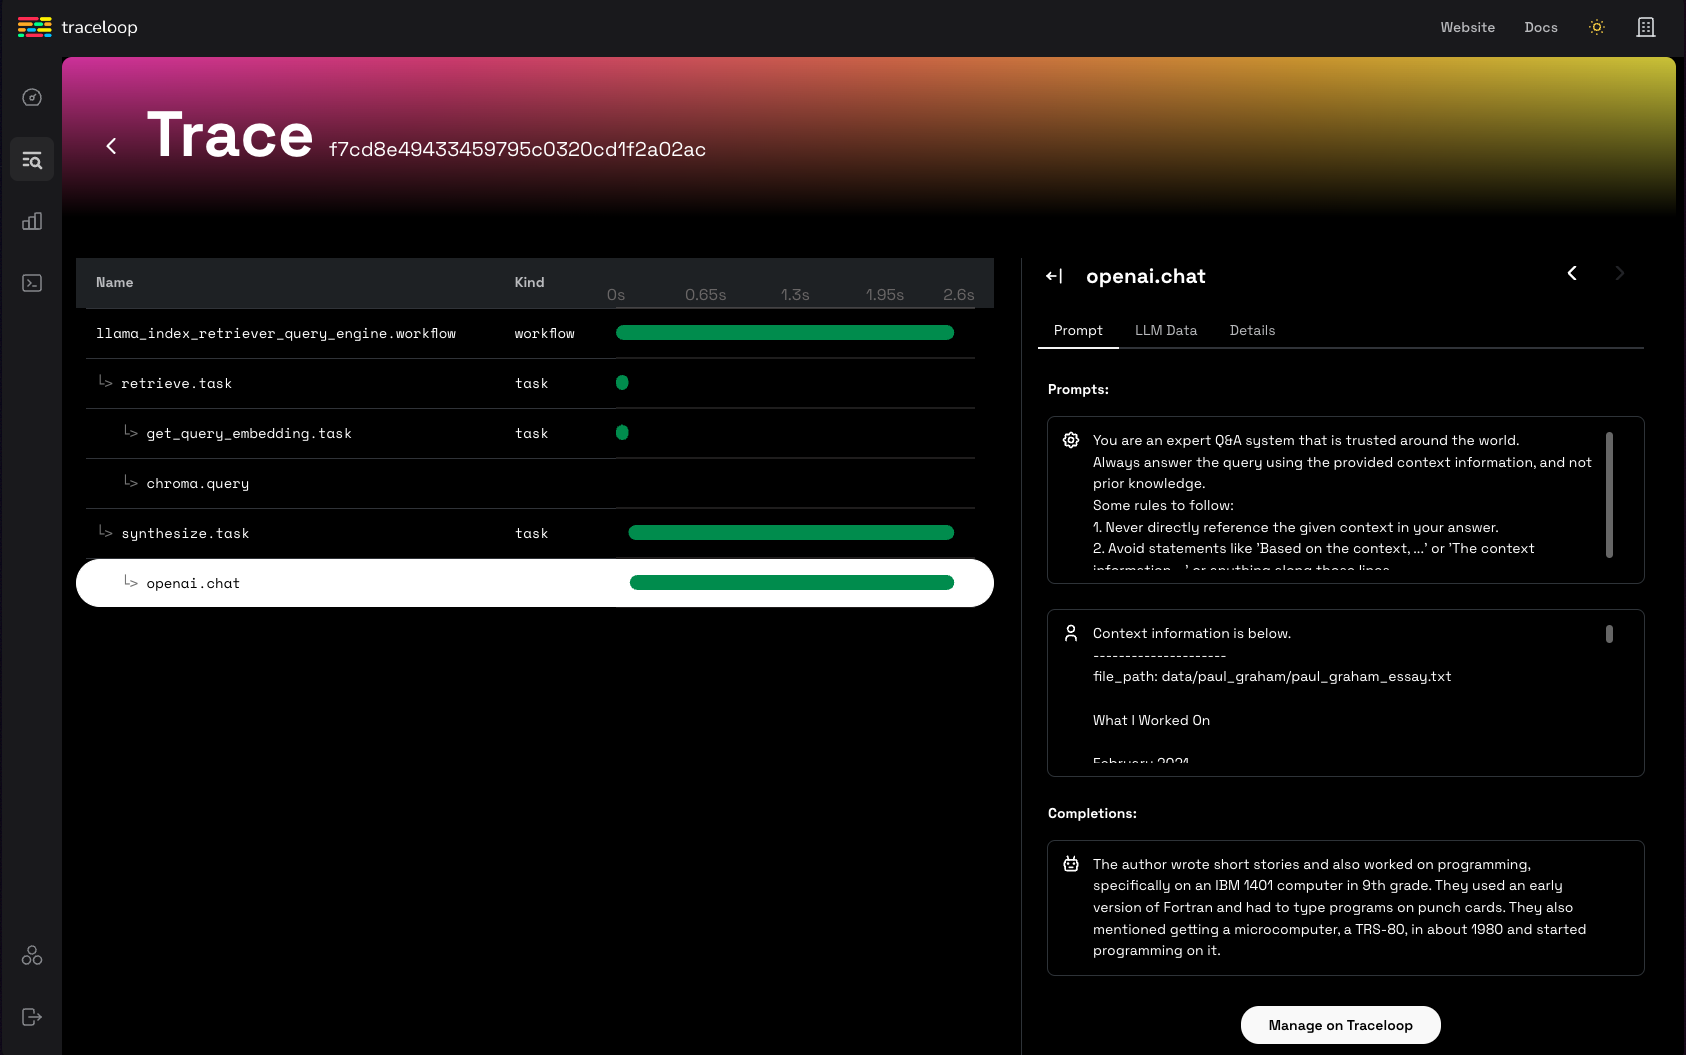
OpenLLMetry#
OpenLLMetry is an open-source project based on OpenTelemetry for tracing and monitoring LLM applications. It connects to all major observability platforms and installs in minutes.
Usage Pattern#
from traceloop.sdk import Traceloop

Traceloop.init()
Guides#
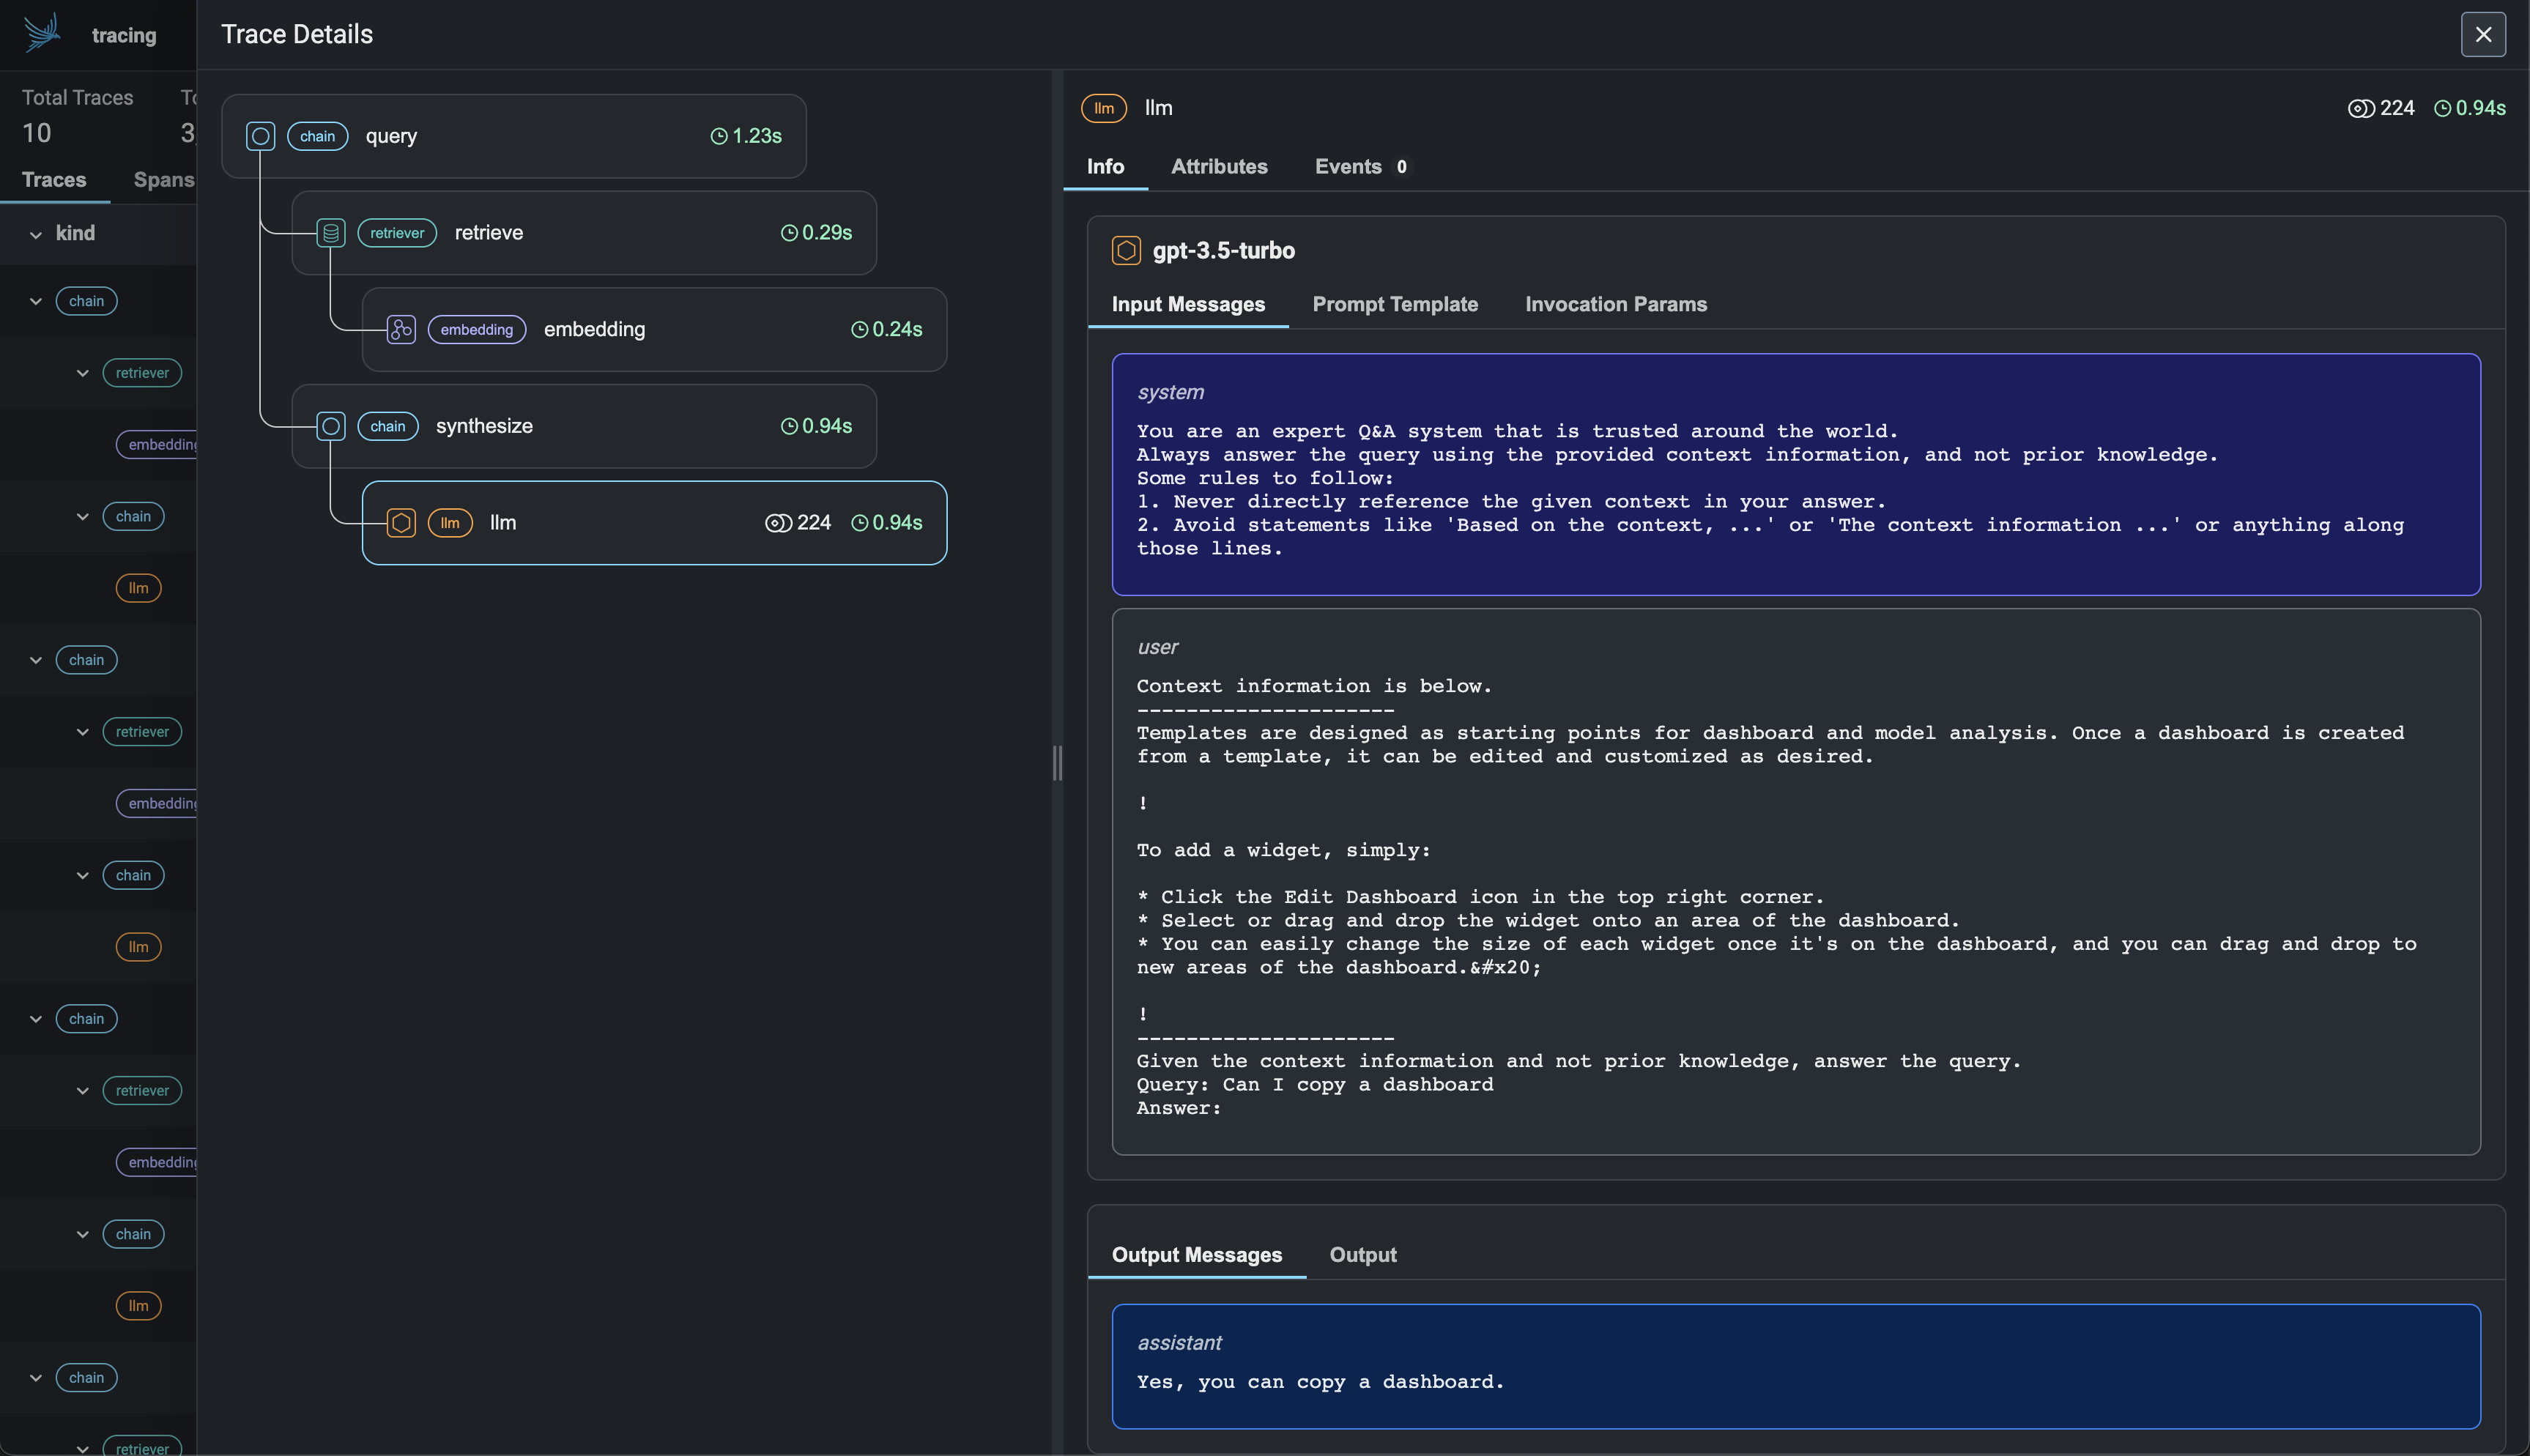
Arize Phoenix#
Arize Phoenix: LLMOps insights at lightning speed with zero-config observability. Phoenix provides a notebook-first experience for monitoring your models and LLM Applications by providing:
- LLM Traces - Trace through the execution of your LLM Application to understand the internals of your LLM Application and to troubleshoot problems related to things like retrieval and tool execution.
- LLM Evals - Leverage the power of large language models to evaluate your generative model or application's relevance, toxicity, and more.
Usage Pattern#
# Phoenix can display in real time the traces automatically
# collected from your LlamaIndex application.
import phoenix as px

# Look for a URL in the output to open the App in a browser.
px.launch_app()
# The App is initially empty, but as you proceed with the steps below,
# traces will appear automatically as your LlamaIndex application runs.

import llama_index.core

llama_index.core.set_global_handler("arize_phoenix")

# Run all of your LlamaIndex applications as usual and traces
# will be collected and displayed in Phoenix.
...
Guides#
OpenInference#
OpenInference is an open standard for capturing and storing AI model inferences. It enables experimentation, visualization, and evaluation of LLM applications using LLM observability solutions such as Phoenix.
Usage Pattern#
import llama_index.core

llama_index.core.set_global_handler("openinference")

# NOTE: No need to do the following
from llama_index.callbacks.openinference import OpenInferenceCallbackHandler
from llama_index.core.callbacks import CallbackManager
from llama_index.core import Settings

# callback_handler = OpenInferenceCallbackHandler()
# Settings.callback_manager = CallbackManager([callback_handler])

# Run your LlamaIndex application here...
for query in queries:
    query_engine.query(query)

# View your LLM app data as a dataframe in OpenInference format.
from llama_index.core.callbacks.open_inference_callback import as_dataframe

query_data_buffer = llama_index.core.global_handler.flush_query_data_buffer()
query_dataframe = as_dataframe(query_data_buffer)
NOTE: To unlock capabilities of Phoenix, you will need to define additional steps to feed in query/ context dataframes. See below!
Guides#
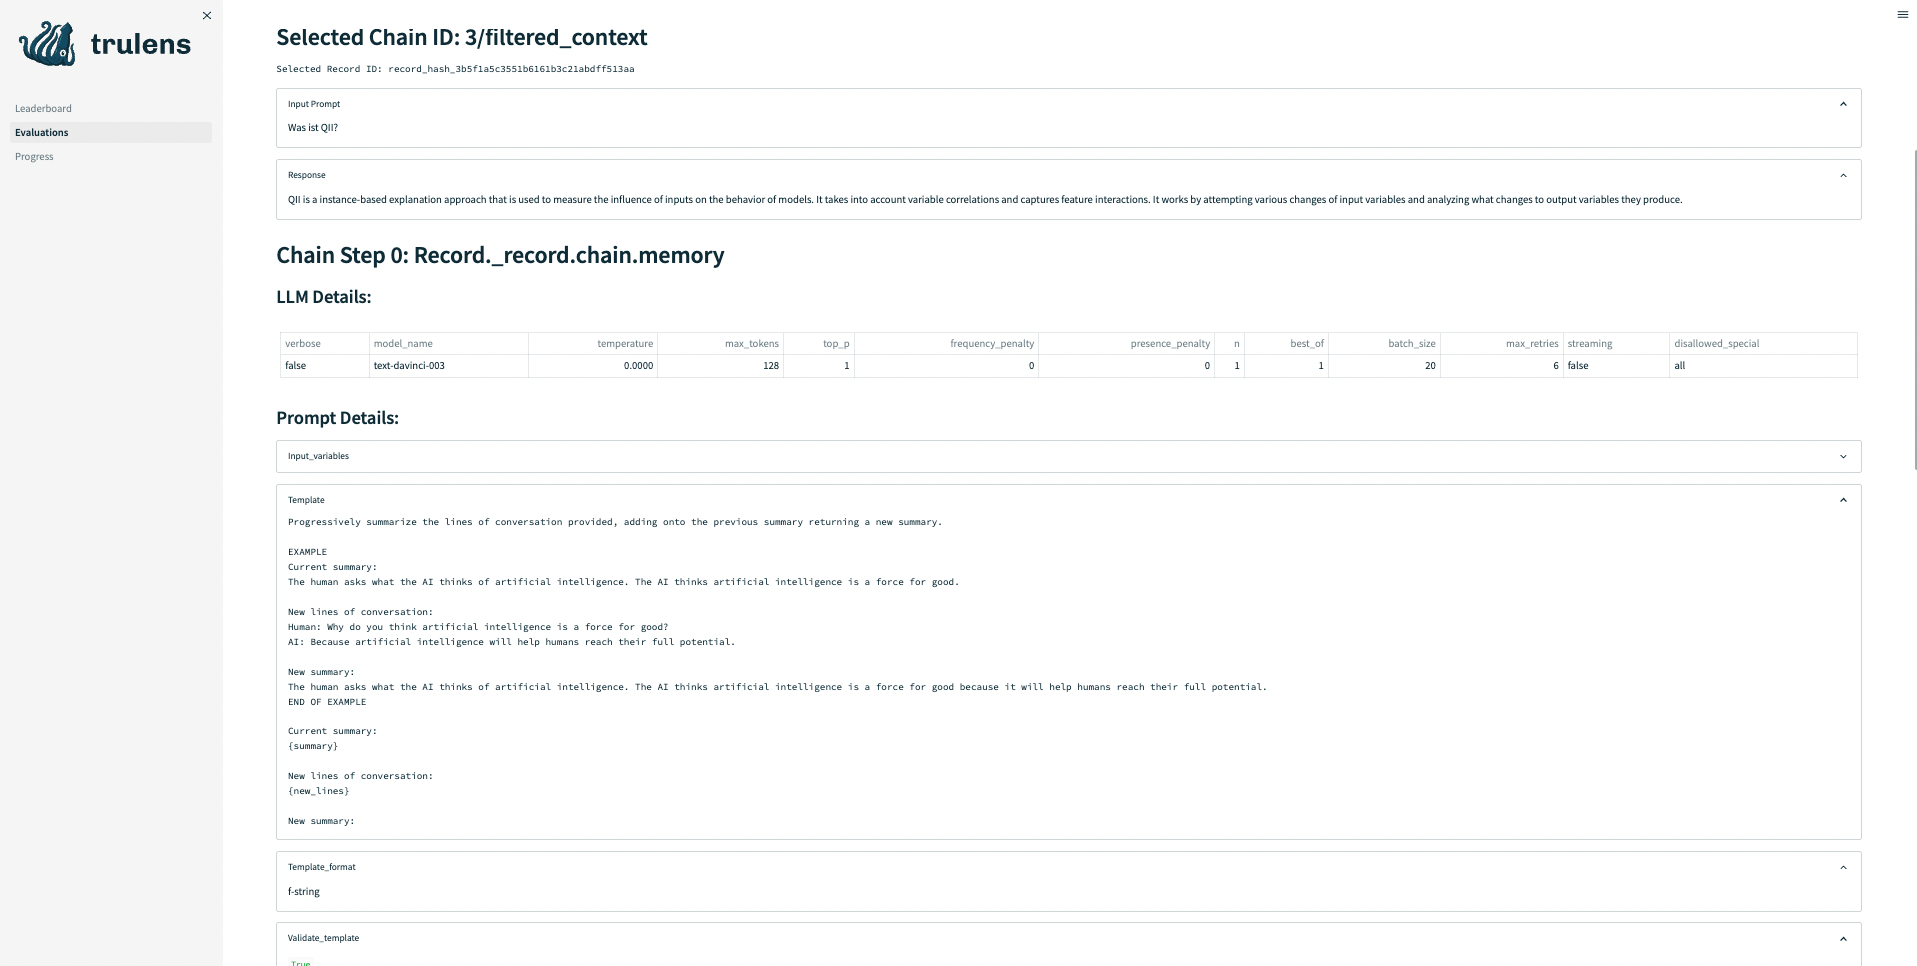
TruEra TruLens#
TruLens allows users to instrument/evaluate LlamaIndex applications, through features such as feedback functions and tracing.
Usage Pattern + Guides#
# use trulens
from trulens_eval import TruLlama

tru_query_engine = TruLlama(query_engine)

# query
tru_query_engine.query("What did the author do growing up?")
Guides#
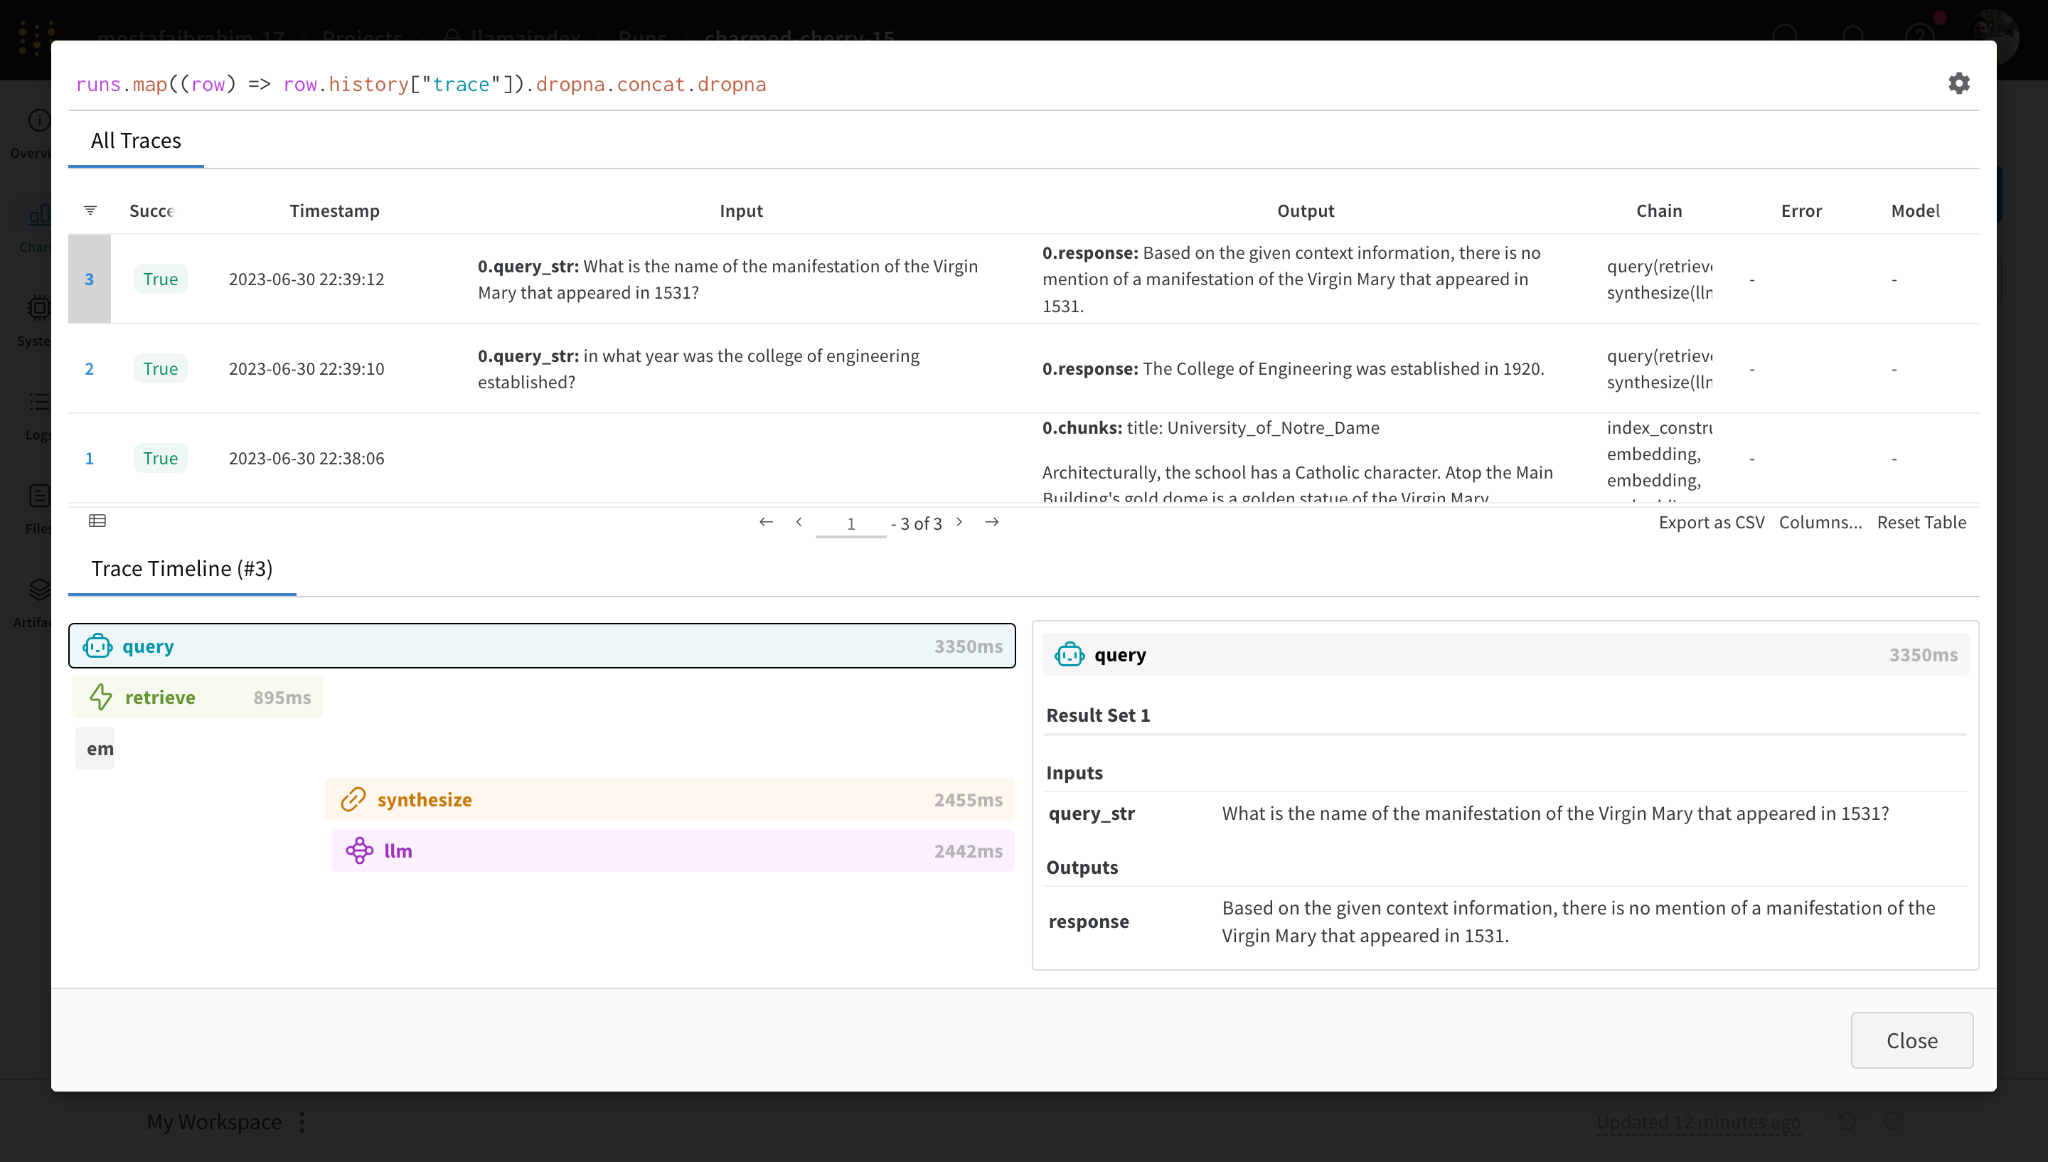
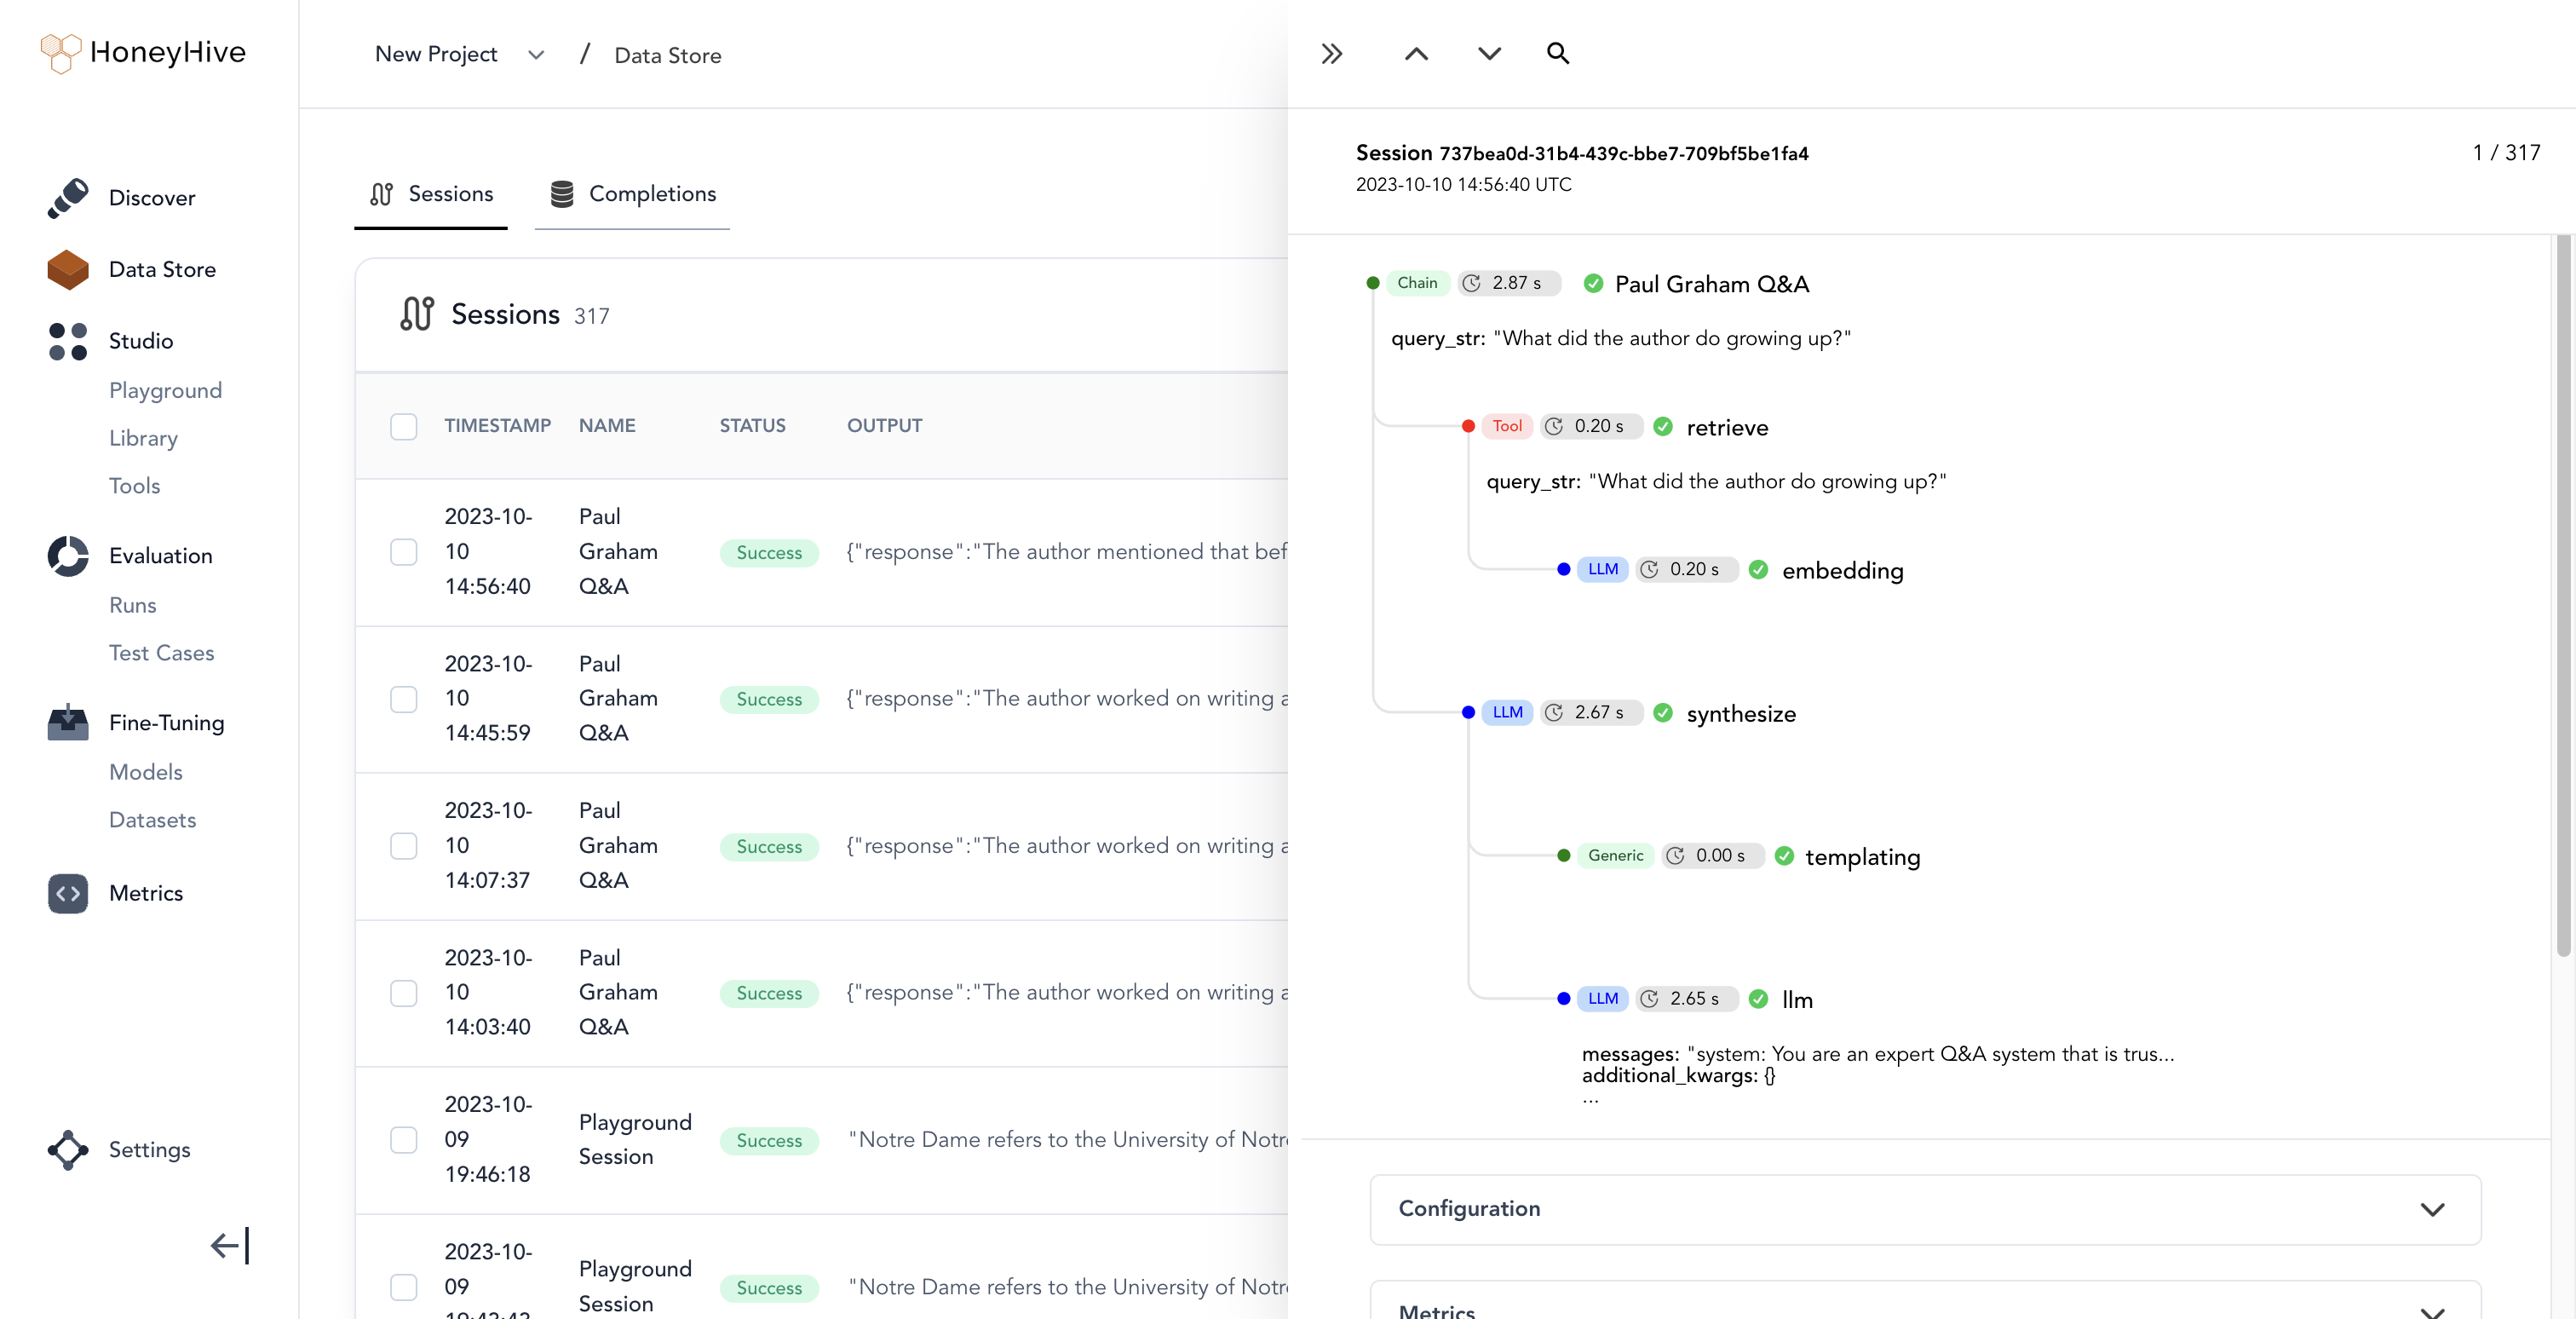
HoneyHive#
HoneyHive allows users to trace the execution flow of any LLM pipeline. Users can then debug and analyze their traces, or customize feedback on specific trace events to create evaluation or fine-tuning datasets from production.
Usage Pattern#
from llama_index.core import set_global_handler

set_global_handler(
    "honeyhive",
    project="My HoneyHive Project",
    name="My LLM Pipeline Name",
    api_key="MY HONEYHIVE API KEY",
)

# NOTE: No need to do the following
from llama_index.core.callbacks import CallbackManager

# from honeyhive.utils.llamaindex_tracer import HoneyHiveLlamaIndexTracer
from llama_index.core import Settings

# hh_tracer = HoneyHiveLlamaIndexTracer(
#     project="My HoneyHive Project",
#     name="My LLM Pipeline Name",
#     api_key="MY HONEYHIVE API KEY",
# )
# Settings.callback_manager = CallbackManager([hh_tracer])
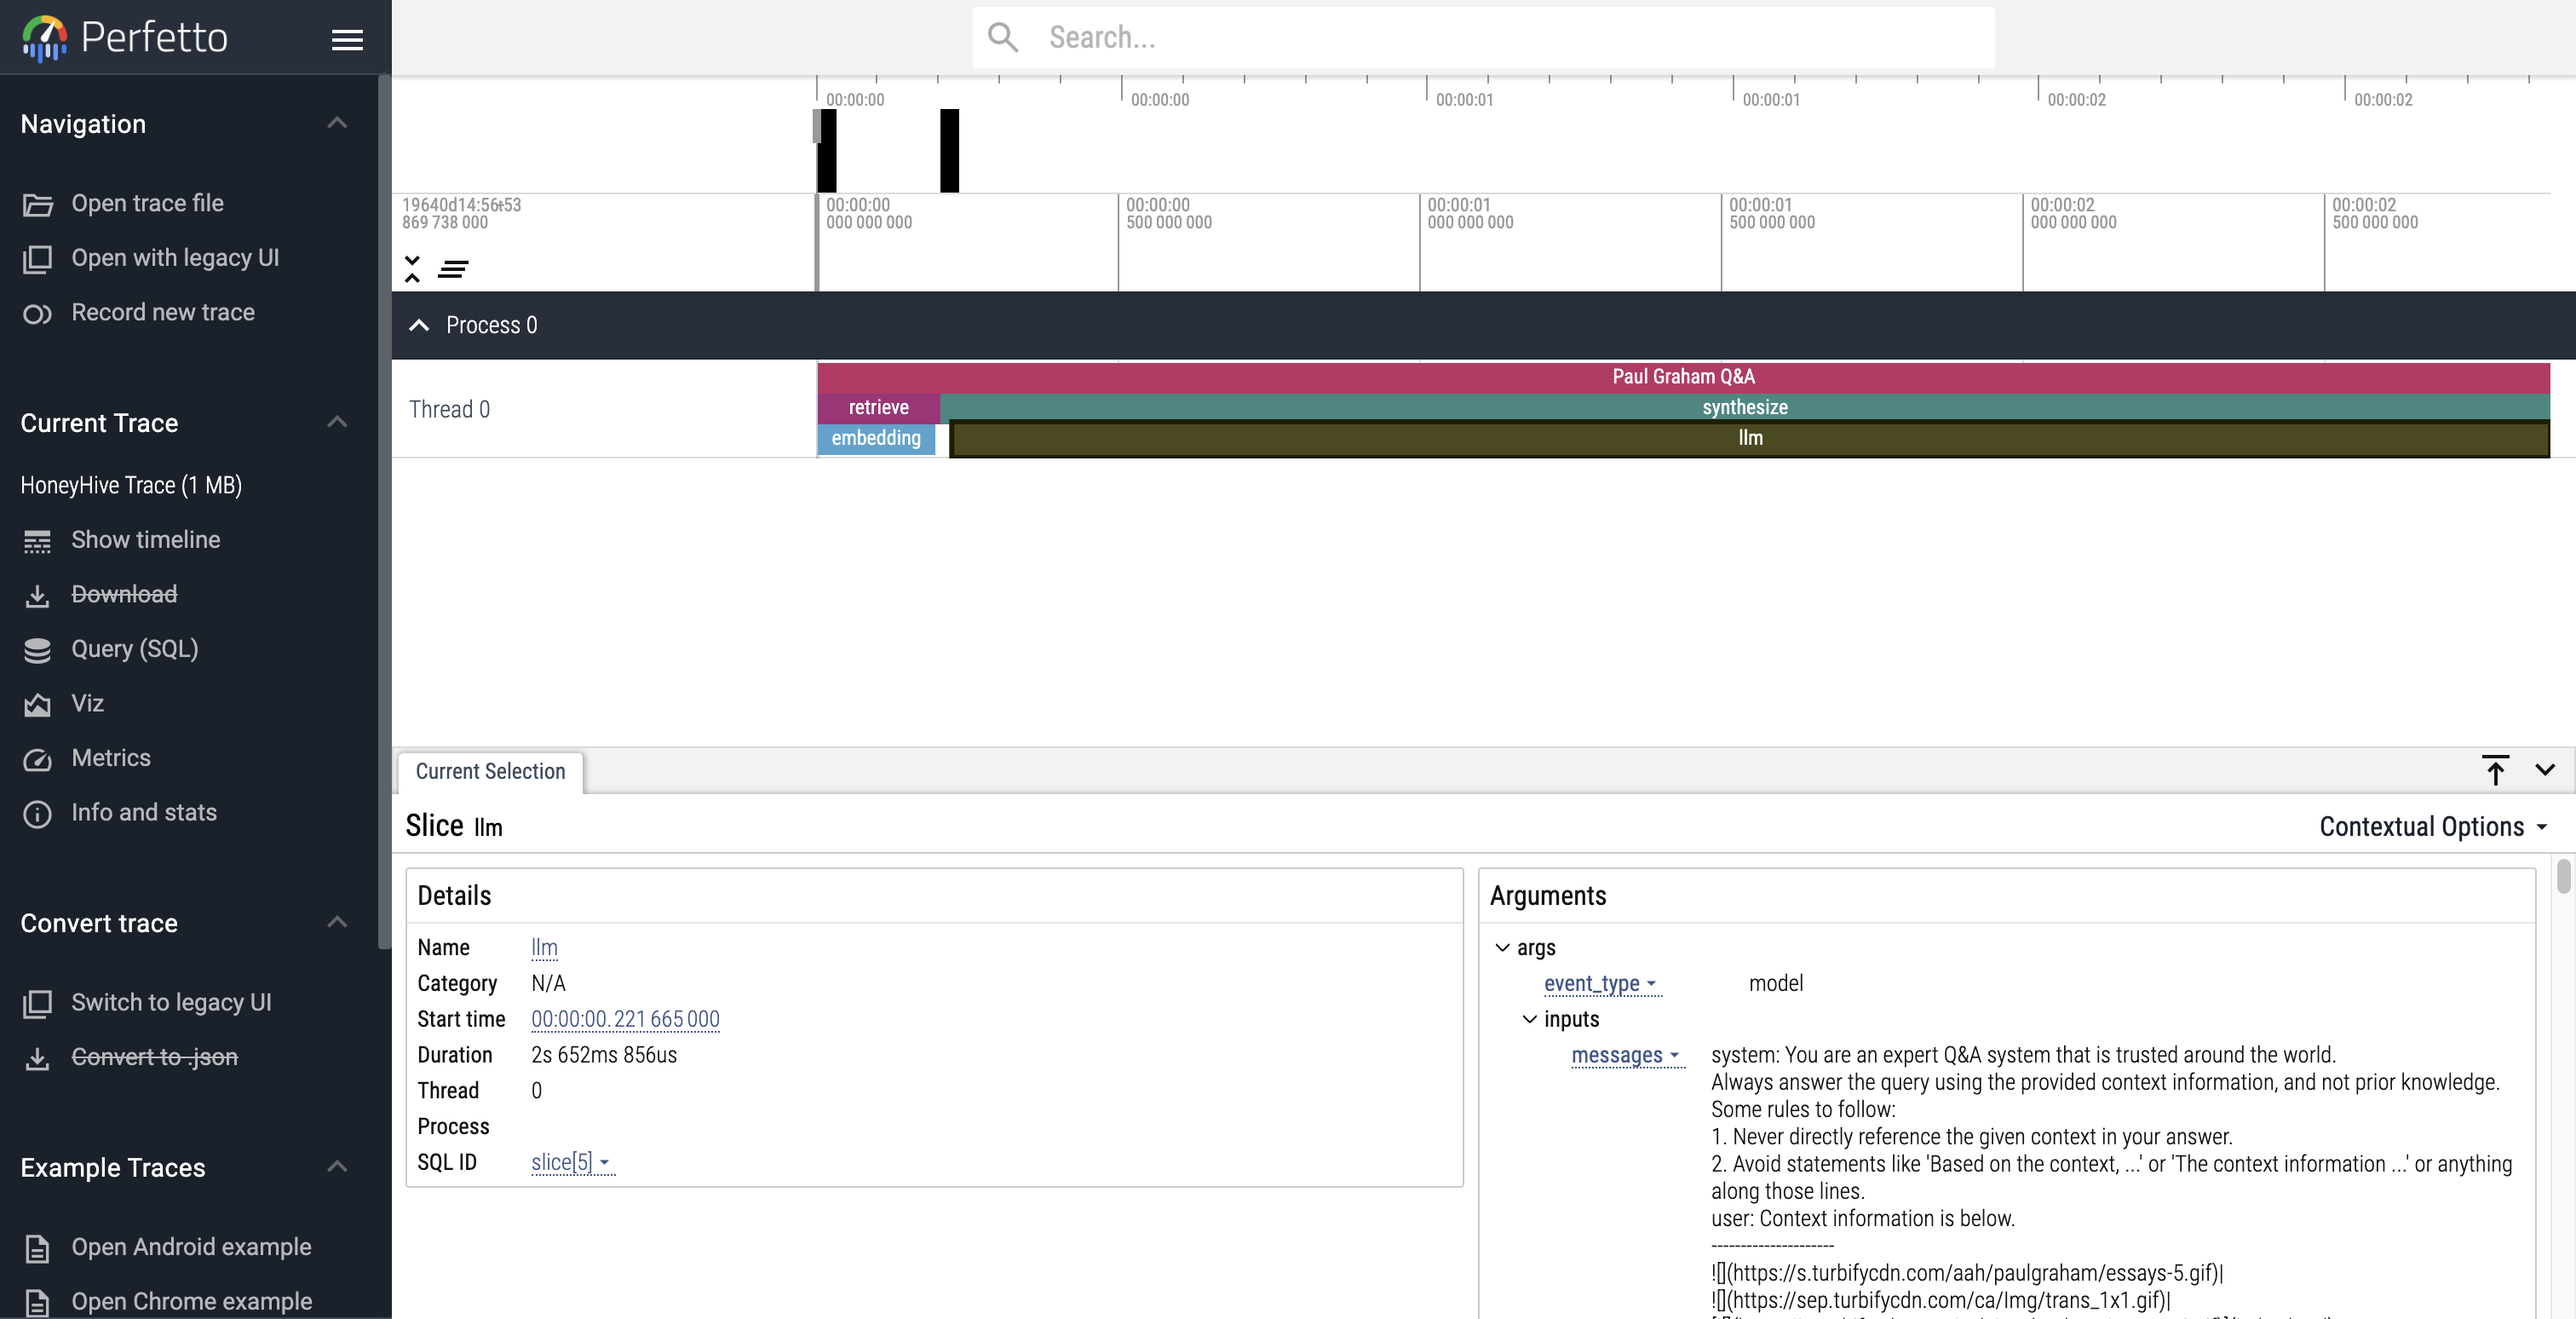 Use Perfetto to debug and analyze your HoneyHive traces
Guides#
PromptLayer#
PromptLayer allows you to track analytics across LLM calls, tagging, analyzing, and evaluating prompts for various use-cases. Use it with LlamaIndex to track the performance of your RAG prompts and more.
Usage Pattern#
import os

os.environ["PROMPTLAYER_API_KEY"] = "pl_7db888a22d8171fb58aab3738aa525a7"

from llama_index.core import set_global_handler

# pl_tags are optional, to help you organize your prompts and apps
set_global_handler("promptlayer", pl_tags=["paul graham", "essay"])